Brand Equity KPIs: That Actually Matter to Your Bottom Line
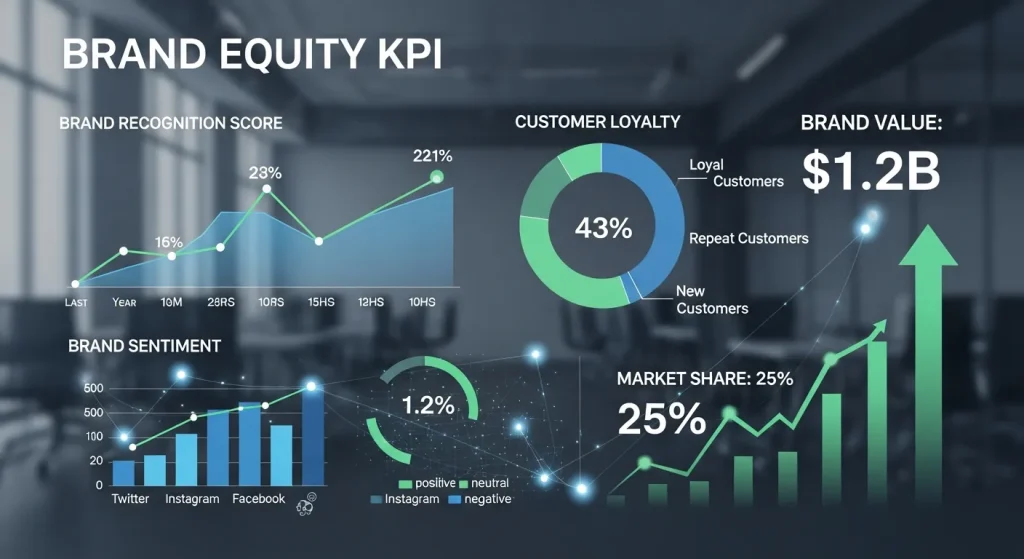
The concept of brand equity often exists in a paradoxical state within organizations—universally acknowledged as valuable yet frequently misunderstood and improperly measured. While executives intuitively recognize strong brands command premium pricing, inspire customer loyalty, and withstand competitive pressures, translating these benefits into concrete financial impact remains challenging. This disconnect creates a vulnerability for brand investments during financial scrutiny.
This comprehensive guide dives deep into the Brand Equity KPIs that truly impact your financial health. You will learn how to move beyond vanity metrics and focus on indicators like price premium capability, customer lifetime value, and margin resilience. We explore integrated measurement frameworks, advanced strategies involving brand perception in marketing, and how to implement these metrics to drive sustainable growth.
Understanding the Business Impact of Brand Equity KPIs
At its core, brand equity represents the commercial value derived from consumer perception of a brand name rather than the product or service itself. This perception-based value manifests in numerous ways: willingness to pay price premiums, preference over comparable alternatives, forgiveness during service failures, and advocacy behaviors that reduce acquisition costs.
However, without tracking the right Brand Equity KPIs, these benefits remain theoretical. Effective measurement connects these behavioral advantages directly to financial benefits through revenue enhancement, margin improvement, and marketing efficiency. The strongest brands simultaneously command higher prices while spending less on customer acquisition—a powerful combination that flows directly to profitability and shareholder returns.
McKinsey research reveals companies with strong brands outperform market indexes by 73% over a 20-year period, demonstrating tangible shareholder value from brand strength. This performance advantage stems from the fundamental relationship between consumer perception and purchase behavior. When customers attribute positive qualities to your brand—whether functional reliability or identity alignment—these perceptions directly influence purchase decisions and price sensitivity.
Moving Beyond Vanity Metrics
Traditional brand measurement often emphasizes awareness, recall, and sentiment metrics. While easily obtained, these provide limited insight into financial impact. A brand could achieve perfect recognition while failing to convert that awareness into customer preference or purchase behavior that generates revenue.
Meaningful Brand Equity KPIs focus instead on metrics with demonstrated correlation to business performance. These metrics establish clear pathways between brand perception in marketing and financial outcomes through validated relationship models rather than assumed connections. This approach distinguishes between interesting brand information and actionable brand intelligence that drives business decisions.
At BrandsDad, we advocate for integrated measurement frameworks that connect perceptual metrics with behavioral and financial indicators. This integrated approach provides both diagnostic insights for brand management and validation metrics for financial stakeholders.
Core Financial Brand Equity KPIs

Several key metrics demonstrate a direct connection between brand equity and financial performance. Each metric illuminates different aspects of how brand perception translates to business value.
1. Price Premium Capability
Price Premium Capability represents perhaps the most direct financial benefit of strong brand equity. This Brand Equity KPI quantifies a brand’s ability to command higher prices than comparable competitors offering similar functional benefits. Measuring this premium requires rigorous competitive brand analysis that isolates brand-driven price differences from other variables like feature sets or service levels.
Calculating price premium involves comparing your realized pricing against reference competitors weighted by market share. The resulting percentage represents purely brand-driven pricing power.
- For luxury brand marketing, this premium often exceeds 50% of base product value.
- Even in commodity-adjacent categories like CPG brand marketing, strong brands frequently capture 10-15% premiums.
This metric directly impacts profit margins and demonstrates immediate financial benefit from brand investment. It answers the question: “How much extra are people willing to pay just because it’s us?”
2. Customer Acquisition Cost (CAC) Differential
This KPI measures how brand equity reduces marketing expenses through improved conversion rates and organic discovery. Strong brands convert prospects more efficiently and attract greater unpaid visibility through word-of-mouth and earned media. This efficiency creates measurable marketing cost reductions compared to weaker competitors.
The metric compares customer acquisition costs against category benchmarks while controlling for market position and growth rate. According to Bain & Company research, companies with superior brand perception typically spend 10-30% less per acquisition while maintaining comparable growth rates. This advantage compounds over time as customer bases expand, representing substantial cumulative savings flowing directly to profitability.
3. Customer Lifetime Value (CLV) Enhancement
Customer Lifetime Value Enhancement quantifies brand equity’s impact on customer relationship duration and spending patterns. Strong brands enjoy longer customer tenures, higher cross-selling success, greater share-of-wallet, and more effective retention efforts. These advantages significantly increase the revenue generated from each customer relationship over time.
This metric compares average customer lifetime value segmented by brand perception scores while controlling for demographic variables. The relationship between perception and lifetime value provides direct evidence of brand equity’s financial impact. Research from brand measurement firm Kantar Millward Brown demonstrates that customers with strong brand connections deliver 23% higher lifetime value than those with purely functional relationships.
4. Margin Resilience During Downturns
This KPI measures brand equity’s protective value during challenging market conditions. Strong brands maintain pricing power and customer loyalty during economic contractions when weaker competitors resort to discounting. This resilience preserves profitability through volatile business cycles and provides strategic flexibility when resources become constrained.
The metric examines margin stability during industry downturns compared to category averages. Premium brands frequently maintain 80% or more of their normal margins during contractions, while weaker competitors experience margin compression exceeding 40%. This stabilizing effect is a crucial component of brand resilience strategies, reducing corporate risk profiles.
Comparison of Financial Brand Equity KPIs
|
KPI Metric |
What It Measures |
Financial Impact |
|---|---|---|
|
Price Premium |
Ability to charge more than competitors |
Direct increase in profit margins |
|
CAC Differential |
Efficiency of marketing spend |
Reduced operational costs |
|
CLV Enhancement |
Total value of a customer over time |
Long-term revenue stability |
|
Margin Resilience |
Profitability during economic downturns |
Risk mitigation and stability |
Behavioral Indicators of Brand Equity
While financial metrics provide the most direct evidence, behavioral indicators offer predictive insight into future financial performance. These Brand Equity KPIs capture customer actions that demonstrate brand influence on decision-making processes.
Consideration Rate
Consideration Rate measures brand presence in customer purchase deliberations. This metric tracks the percentage of category shoppers who include your brand in their consideration set before making purchase decisions. Strong brands achieve consideration rates exceeding their actual market share, creating a fundamental advantage in conversion opportunities. This expanded presence in decision processes directly influences market share potential and reduces dependency on point-of-purchase marketing.
Referral Generation and Advocacy
Referral Generation quantifies customer willingness to stake personal reputation on brand recommendations. This behavior represents one of the strongest indicators of brand equity in marketing while directly reducing customer acquisition costs. Measuring both referral volume and conversion rates provides visibility into this powerful acquisition channel that combines high prospect quality with low marketing expense. It is a key component of effective referral marketing.
Search Preference (Branded Search Volume)
Search Preference captures brand equity’s impact on discovery behaviors. Brands with strong equity receive disproportionate direct search volume (e.g., searching “Nike shoes” vs. “running shoes”). This preference creates significant digital marketing advantages through higher organic traffic, lower paid search costs, and improved conversion rates from brand-specific searchers with established purchase intent. Tools like SEMrush and Google Search Console are essential for tracking this Brand Equity KPI.
Price Sensitivity Measurement
Price Sensitivity Measurement examines how brand perception modifies price elasticity across customer segments. This metric quantifies the relationship between brand connection strength and customer price tolerance, typically revealing substantial elasticity differences between brand enthusiasts and transactional customers. Understanding these sensitivity variations enables more sophisticated pricing strategies that maximize revenue from each customer segment.
Brand Perception Metrics That Predict Financial Performance
Certain perception metrics demonstrate strong correlation with subsequent financial outcomes. These predictive indicators help brand managers focus on perceptual drivers that actually influence purchase behavior rather than interesting but commercially irrelevant attitudes.
Differentiation Perception
Differentiation Perception consistently shows a strong predictive relationship with financial performance across categories and time periods. Brands perceived as meaningfully different from alternatives demonstrate significantly stronger pricing power and consideration advantages. This metric measures perception of distinctive brand attributes or experiences rather than general positivity or awareness. It is the cornerstone of brand positioning strategy.
Value Perception Relative to Price
Value Perception Relative to Price measures perceived worth compared to actual pricing, reflecting the fundamental value equation in customer minds. This perception directly influences purchase conversion rates and repeat behavior. Importantly, value perception differs from absolute price position—premium brands can achieve strong value perception despite high pricing when benefits align with customer priorities.
Trust Metrics
Trust Metrics capture confidence in brand promises and reliability. Trust functions as a purchase accelerator by reducing perceived risk and decision complexity. Categories involving significant financial commitment, personal vulnerability, or long-term relationships show particularly strong correlation between trust metrics and purchase behavior. Trust measurement is essential for brand safety in digital marketing and maintaining brand authority.
Identity Alignment
Identity Alignment measures how strongly customers see the brand reflecting their actual or aspirational self-image. This connection creates resistance to competitive alternatives by embedding brand choice within personal identity. Categories with public consumption or lifestyle signaling show especially strong financial impact from identity alignment, though even utilitarian categories benefit from fundamental value alignment.
Integrated Measurement Frameworks

The most effective measurement of Brand Equity KPIs employs integrated frameworks connecting perception metrics with behavioral indicators and financial outcomes. These frameworks establish causal pathways demonstrating how specific brand perceptions drive behaviors that generate financial results.
Brand Funnel Analysis
Brand Funnel Analysis examines conversion efficiency through awareness, familiarity, consideration, preference, purchase, and loyalty stages. By measuring drop-off rates between stages segmented by brand perception scores, this approach identifies specific perception barriers limiting financial performance. The resulting insights guide targeted investment to address conversion bottlenecks rather than generic brand building. This is vital for optimizing the customer journey mapping process.
Brand Driver Modeling
Brand Driver Modeling uses statistical analysis to identify which specific brand perceptions most strongly influence purchase behavior in your category. This approach typically combines survey data with actual purchase records to validate relationships between stated perceptions and economic behaviors. The resulting models provide precise guidance for brand strategy road maps based on financial impact potential.
Brand Contribution Analysis
Brand Contribution Analysis isolates brand equity’s role in purchase decisions from other factors like price, convenience, features, or distribution. This decomposition provides clear visibility into which portion of business performance comes from brand strength versus other variables. Understanding this contribution ratio helps organizations make appropriate investment allocations between brand building and other business capabilities.
Implementing Effective Measurement of Brand Equity KPIs
Creating meaningful Brand Equity KPIs requires thoughtful implementation rather than simply deploying standard metrics. Several principles guide effective implementation that delivers actionable intelligence with credible financial connections.
Establish Measurement Consistency
Establish measurement consistency that enables trend analysis over time. Brand equity develops gradually, requiring consistent measurement approaches that track progression against strategic objectives. While measurement systems can evolve, maintaining core metrics ensures comparable results across measurement periods. This is crucial for tracking brand longevity challenges.
Incorporate Competitive Benchmarking
Incorporate competitive benchmarking that contextualizes your brand metrics against relevant alternatives. Brand performance exists relative to competitive options, making isolated measurements meaningless without comparative context. Effective benchmarking includes both direct competitors and aspirational brands from adjacent categories that set consumer expectations.
Segment Analysis
Segment analysis reveals critical differences in brand perception and behavior across customer groups. These variations highlight targeted improvement opportunities that aggregate metrics might obscure. Particularly valuable segments include current customers versus prospects, high-value versus occasional customers, and demographically distinct groups.
Link Brand Tracking with Actual Purchase Data
Link brand tracking with actual purchase data whenever possible to validate relationships between stated perceptions and economic behaviors. This validation strengthens financial stakeholder confidence in brand measurement while improving predictive accuracy. Modern measurement approaches increasingly incorporate first-party transaction data alongside traditional survey methodologies to create this crucial connection.
Organizational Implementation Considerations
Beyond technical measurement approaches, several organizational factors determine whether Brand Equity KPIs successfully influence business decisions and investment allocations.
Executive Alignment
Executive alignment around brand equity definition and expected outcomes establishes the necessary foundation for measurement success. Without shared understanding of what brand equity means for your specific organization, metrics lack contextual relevance regardless of technical sophistication. This alignment process should define explicit relationships between brand marketing strategy and business strategy.
Cross-Functional Involvement
Cross-functional involvement improves both measurement design and result application. When stakeholders from finance, operations, product development, and customer service participate in brand measurement frameworks, the resulting metrics gain broader credibility and application. This collaborative approach ensures brand insights influence decisions beyond marketing communications to shape comprehensive customer experience.
Regular Reporting Cadences
Regular reporting cadences integrated with business performance reviews establish Brand Equity KPIs as core business indicators rather than occasional marketing updates. This integration normalizes brand measurement within business discussions and creates accountability for brand performance alongside operational metrics.
Future Evolution of Brand Equity Measurement
Brand measurement continues evolving alongside changing consumer behaviors and available data sources. Several emerging approaches promise to enhance measurement accuracy and financial connectivity in coming years.
Real-Time Measurement and Digital Signals
Real-time measurement increasingly supplements periodic tracking studies, capturing dynamic brand perception shifts through continuous digital signals. These approaches monitor social media sentiment, search behavior, review content, and digital engagement patterns to provide ongoing visibility into brand perception between formal measurement intervals. Tools for brand monitoring services and review management services are essential here.
Artificial Intelligence and Predictive Modeling
Artificial intelligence applications are enhancing brand measurement through advanced pattern recognition and predictive modeling capabilities. These technologies identify subtle relationships between brand signals and business outcomes that traditional analysis might overlook. AI is particularly useful in analyzing unstructured data for sentiment analysis and brand sentiment.
Multi-Modal Measurement
Multi-modal measurement recognizes that consumers experience brands through diverse sensory channels beyond verbal descriptions. Advanced approaches now incorporate visual, auditory, and emotional response measurements that capture brand associations traditional verbal surveys cannot access. This is becoming increasingly relevant with the rise of sonic branding and sensory branding.
Conclusion
Effective Brand Equity KPIs ultimately exist to inform better management decisions rather than simply documenting current conditions. The most valuable measurement frameworks provide clear guidance for improving brand perception dimensions with demonstrated financial impact while tracking progress against these strategic objectives.
When properly implemented, brand equity measurement transforms from a cost center to a strategic advantage by connecting intangible brand assets directly to financial outcomes that drive business value. This connection elevates brand management from a subjective creative exercise to a strategic business discipline with measurable return on investment. Organizations that master this discipline gain sustainable competitive advantage through brand assets that competitors cannot easily replicate or acquire.
The journey toward meaningful brand equity measurement begins with a commitment to financial relevance rather than marketing isolation. By focusing on metrics that demonstrate clear connection to business performance, brand leaders earn credibility with financial stakeholders while generating insights that actually improve business results. This financially-grounded approach ensures brand investments receive appropriate resources while delivering accountability for measurable business impact.
Frequently Asked Questions (FAQs)
1. What are the most important Brand Equity KPIs for a small business?
For small businesses, focusing on customer acquisition cost (CAC) and customer lifetime value (CLV) is crucial. These metrics directly impact cash flow and profitability. Additionally, tracking referral rates serves as a strong proxy for brand loyalty and equity without requiring expensive market research studies.
2. How often should I measure Brand Equity KPIs?
Financial metrics like price premium and margin resilience should be reviewed quarterly alongside financial reports. Perception metrics, such as brand awareness and sentiment, can be tracked continuously using digital tools or surveyed bi-annually to identify long-term trends without reacting to short-term noise.
3. Can brand equity be negative?
Yes. If a brand has a poor reputation, consumers may actively avoid it or expect a discount to purchase it. This is negative brand equity. Tracking negative content management and crisis management services is essential to identify and mitigate these issues before they cause lasting financial damage.
4. How does brand equity impact digital marketing costs?
High brand equity lowers digital marketing costs. When users recognize and trust your brand, they are more likely to click on your ads (higher CTR), which lowers your cost-per-click (CPC) on platforms like Google and Facebook. It also increases organic traffic through branded search volume, reducing reliance on paid media buying services.
5. Is Net Promoter Score (NPS) a good Brand Equity KPI?
NPS is a useful metric for customer loyalty and advocacy, but it is not a comprehensive measure of brand equity on its own. It should be used in conjunction with financial metrics like price premium and market share to get a full picture of the brand’s health and economic value.
6. How do I measure brand equity for a B2B company?
In B2B digital marketing strategies, brand equity is often measured by consideration rate and win rate. If your brand is consistently invited to RFPs (Requests for Proposal) and has a higher win rate than competitors at similar price points, you have strong brand equity. building brand authority through thought leadership is a key driver here.
7. What is the role of employee advocacy in brand equity?
Employees are brand ambassadors. High employee engagement and advocacy can improve external brand perception. Metrics like employee net promoter score (eNPS) and participation in social media management (sharing company content) can be secondary indicators of internal brand strength that radiates outward.
8. Can I use Google Analytics to measure brand equity?
Yes, specifically by tracking direct traffic and organic branded search traffic. An increase in users typing your URL directly or searching for your brand name indicates growing brand awareness and equity. You can also analyze bounce rates and time on site to gauge engagement and interest.
9. How does brand cannibalization relate to brand equity metrics?
Brand cannibalization can skew equity metrics if not carefully analyzed. If a new sub-brand steals sales from a premium parent brand, overall revenue might stay the same, but profit margins (a key equity indicator) could drop. Effective measurement involves looking at the brand portfolio as a whole to ensure net positive growth.
10. What tools are best for tracking Brand Equity KPIs?
For digital metrics, SEMrush, Ahrefs, and Google Analytics are essential. For sentiment and perception, tools like Brandwatch, Mention, or survey platforms like Qualtrics are valuable. For financial modeling, integrating your CRM (like Salesforce) with financial software helps track CLV and CAC accurately.